State Program Performance Data – Current Year
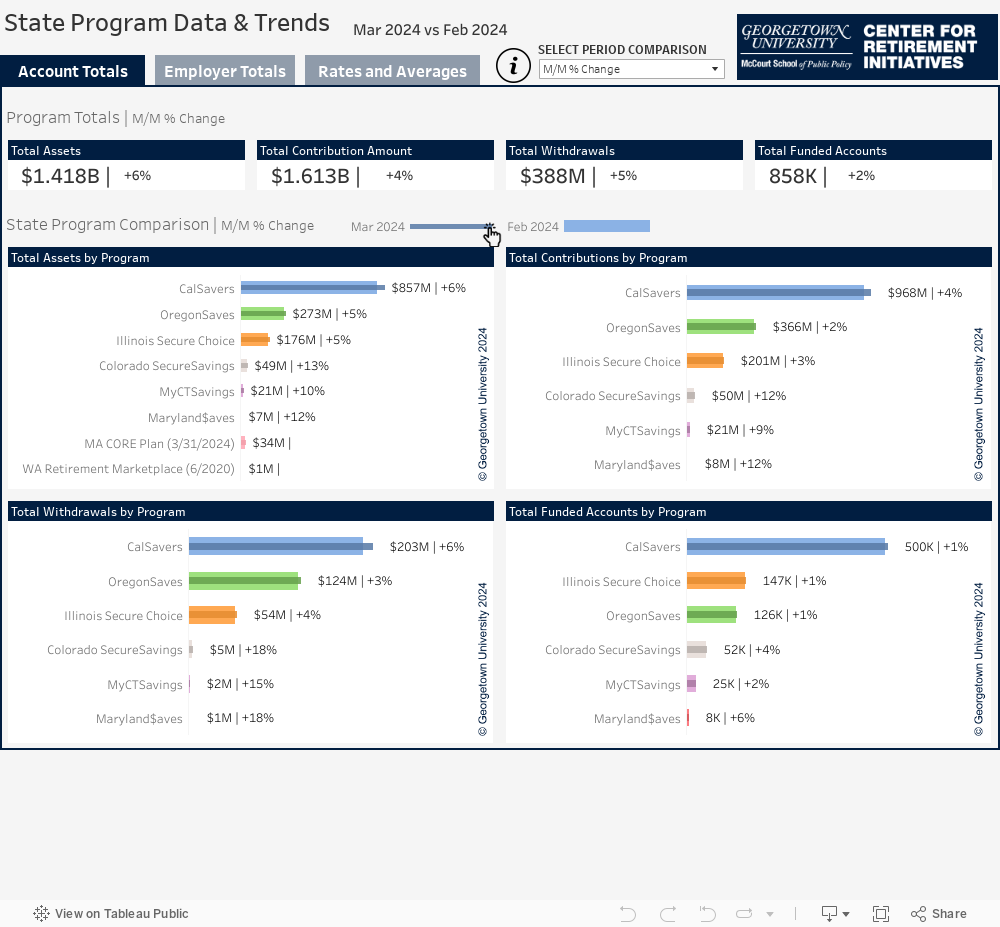
State Auto-IRA Program Data & Trends
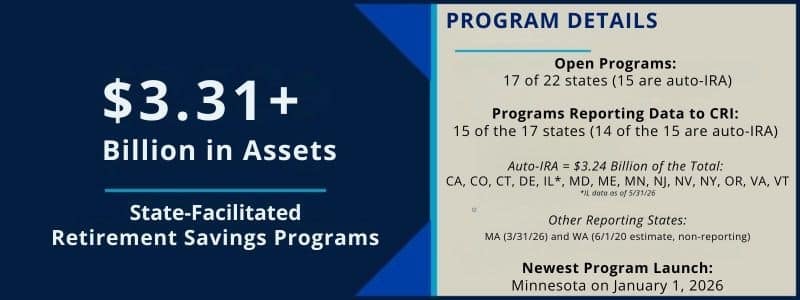
Sources of Data: CalSavers, Colorado SecureSavings Program, MyCTSavings, DE EARNS, My Illinois Savings, MERIT, Maryland$aves, Minnesota Secure Choice Retirement Program, NEST, RetireReadyNJ, New York Secure Choice Savings Program, OregonSaves, RetirePathVA, and Vermont Saves. Some state program data are not publicly available but provided by states to the CRI.
Data Notes:
When attempting to make comparisons across programs, it is important to take into consideration variations in program design. Programs are not identical, and these variations will contribute to differences in performance. The employers covered and default contribution rates are examples of program design differences (see the design features infographic posted below).
Select metrics may not be available for all state programs. Illinois Secure Choice data is recent as of May 31, 2026 with a lag in monthly data reporting due to its program administrator transition. As of June 30, 2026, the New York Secure Choice Retirement Program is not reporting the Total Exempted Employers metric. Select M/M, Q/Q, and Y/Y growth metrics may not yet be available for more recently launched states (for example, Minnesota began reporting as of June 30, 2026).
Proper attribution to the Georgetown University Center for Retirement Initiatives should be made when using the information and data collected, aggregated, and analyzed by Georgetown.
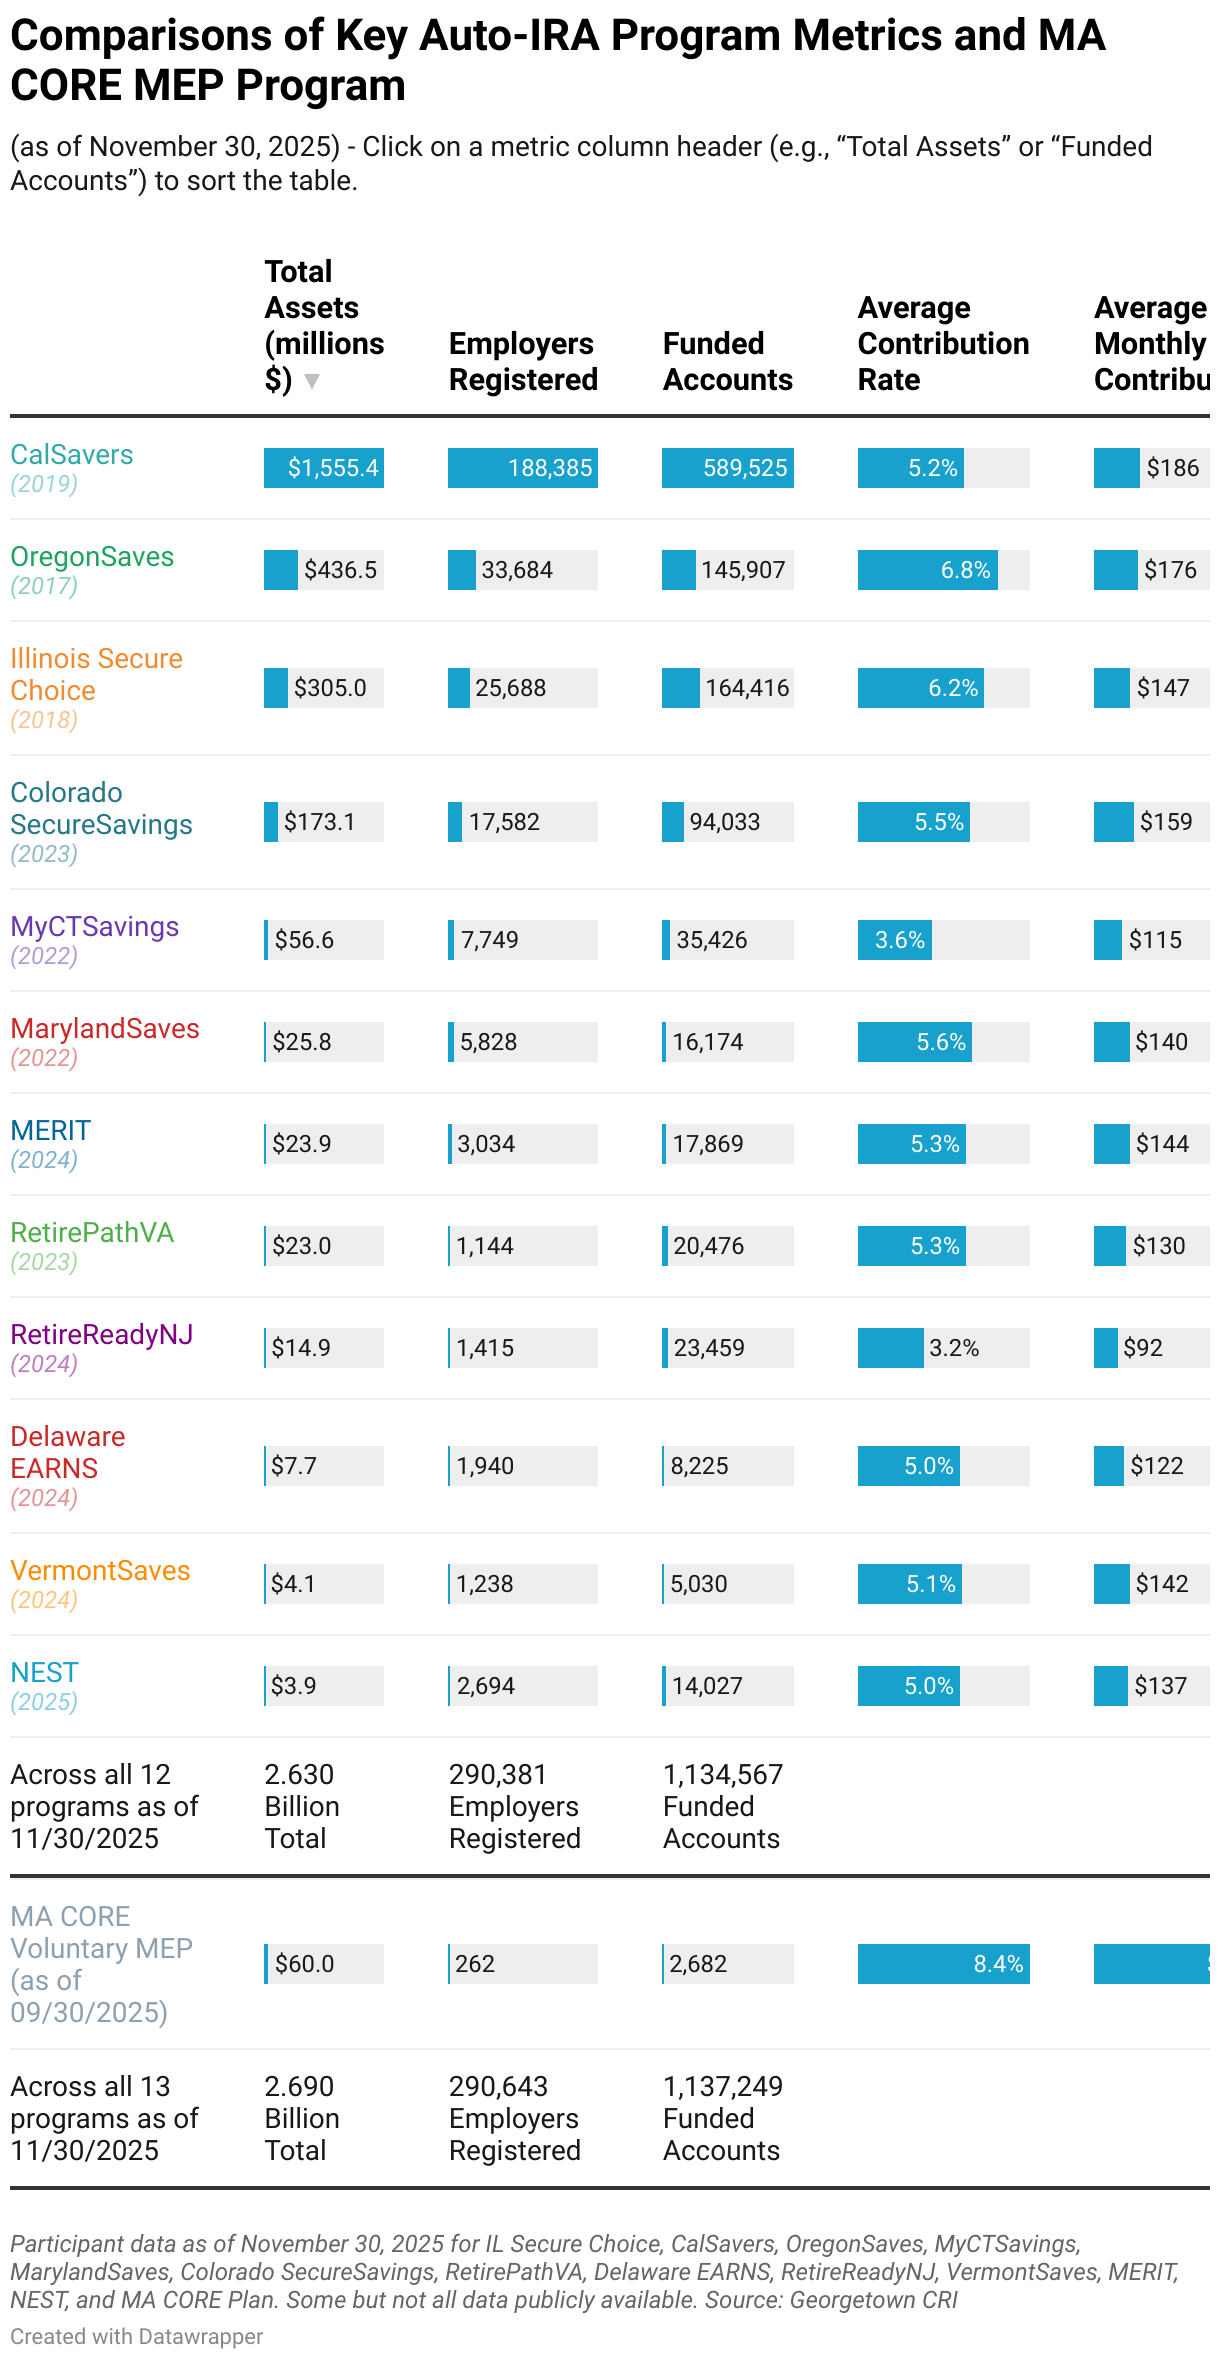
Comparison of Key Auto-IRA and MEP Program Design Features

Other State Program Specific Data
Massachusetts
Key Program Metrics Snapshot
(as of March 31, 2026)

Washington
Key Program Metrics Snapshot
(as of June 2020)

State Performance Data and Reports
If you are interested in specific data and/or analysis of performance trends for state programs, including performance indicators not displayed on this site, contact Angela Antonelli at criretirement@georgetown.edu or call 202-687-4901. View archive of past monthly performance reports (log in required).