State Program Performance Data – PROOF OF CONCEPT
- Monthly State Performance Trends Report
- Monthly State Program Data & Trends
- Monthly Individual State Program Specific Data & Trends
- Quarterly State Program Performance Data & Trends
- Annual and Semi-Annual State Program Performance Data & Trends
* Data under each of these sections above is from state auto-IRA programs and cumulative across all programs, unless otherwise noted (e.g., the monthly individual state program specific data).
New Dashboard
Note: Select metrics may not be available for all state programs.
Note: Y/Y Growth Metrics are not yet available for MyCTSavings, Maryland$aves, and the Colorado SecureSavings Program and in certain instances for other state programs, due to the infancy of the metrics and, in other cases, the significant variations in percent changes that would distort the overall presentation of the information for all states. MyCTSavings opened to all eligible employers in April 2022, Maryland$aves opened to all eligible employers in September 2022, and the Colorado SecureSavings Program opened in January 2023. By comparison, CalSavers, Illinois Secure Choice, and OregonSaves have been open for several years (see below for individual state data).
Monthly State Performance Trends Report
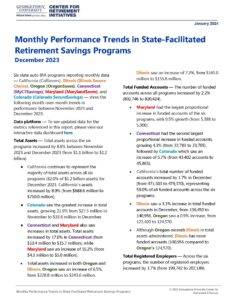
December 2023
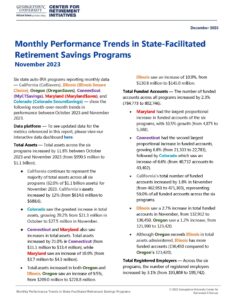
November 2023
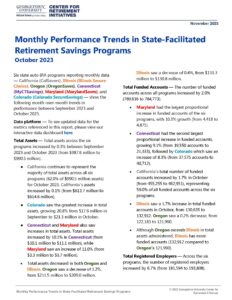
October 2023
Prior months: September 2023, August 2023, July 2023, June 2023, May 2023, April 2023, March 2023, February 2023, January 2023
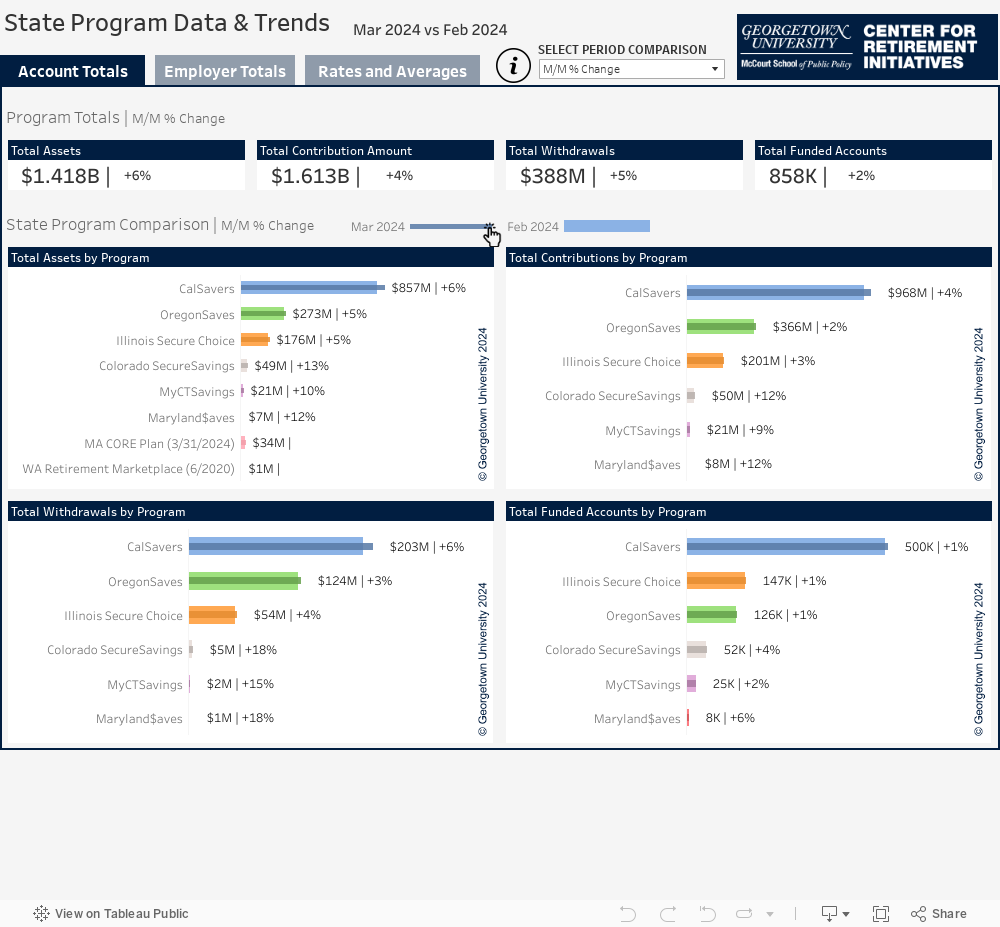
Monthly State Program Data & Trends
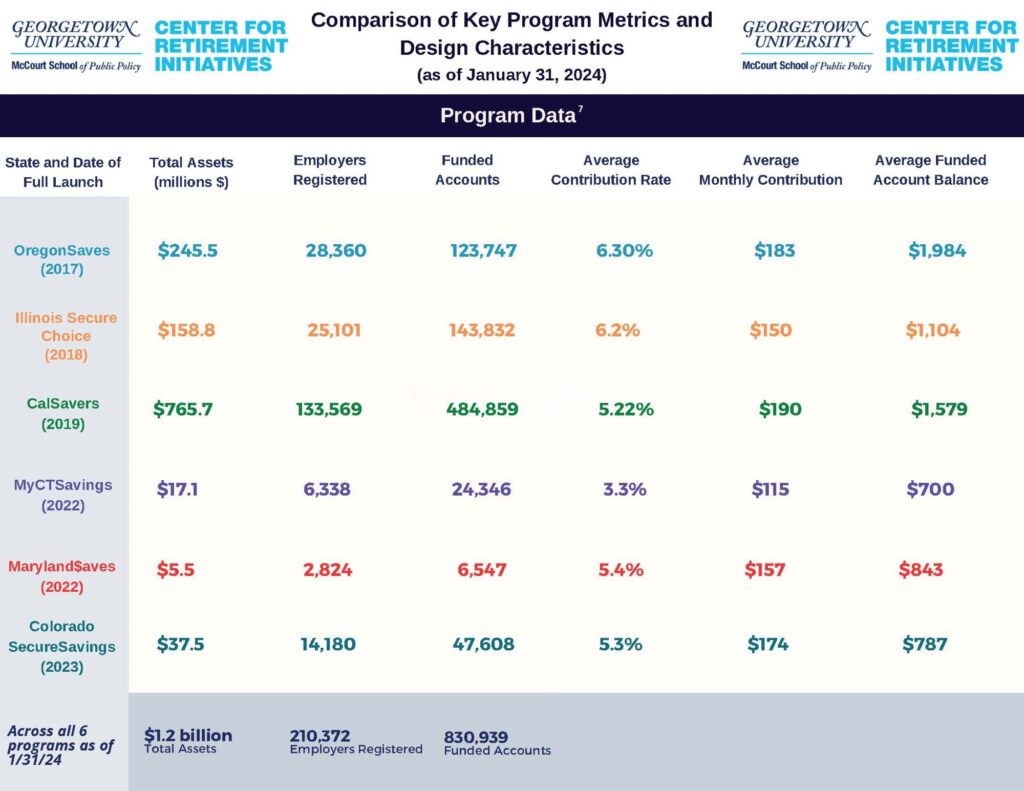
Comparison of Key Program Metrics and Design Characteristics
(CA, CT, CO, IL, MD and OR)
December 31, 2023
Monthly Individual State Program Specific Data & Trends
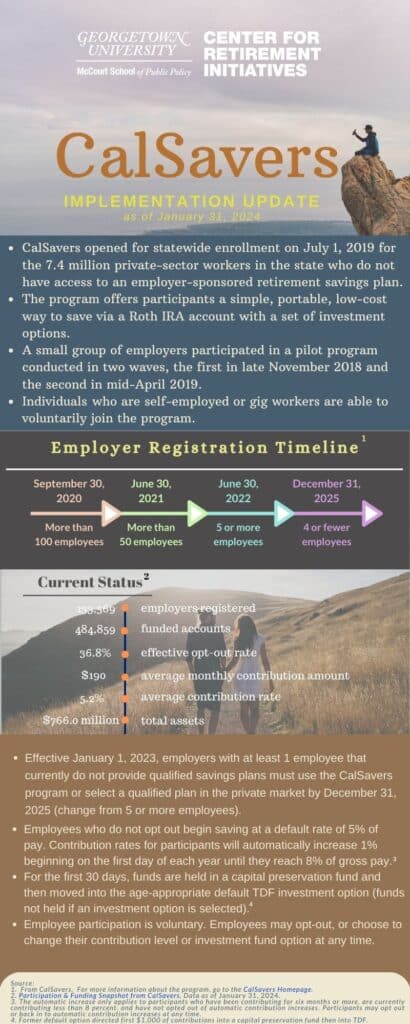
California
(2019)
Key Program Metrics Snapshot
(as of December 31, 2023)
Program Performance Indicators, Monthly Percent Change
(as of December 31, 2023)
| 11/30/23 | 12/31/23 | Percent Change 11/30/23-12/31/23 | |
| Total Assets | $688,601,053 | $749,976,251 | 8.9% |
| Total Contributions Amount | $832,239,980 | $864,267,764 | 3.8% |
| Total Withdrawals | $157,477,854 | $166,271,026 | 5.6% |
| Total Funded Accounts | 471,303 | 479,370 | 1.7% |
| Accounts with Withdrawals (Full and Partial) | 113,394 | 116,651 | 2.9% |
| Average Contribution Rate | 5.13% | 5.13% | |
| Average Monthly Contribution Amount | $176 | $170 | -3.4% |
| Average Funded Account Balance | $1,461 | $1,565 | 7.1% |
| Effective Opt-Out Rate | 37.0% | 36.9% | |
| Total Registered Employers | 124,571 | 131,250 | 5.4% |
| Total Exempted Employers | 121,288 | 124,821 | 2.9% |
| Source: Calculations by the Georgetown University Center for Retirement Initiatives based on data from CalSavers. | |||
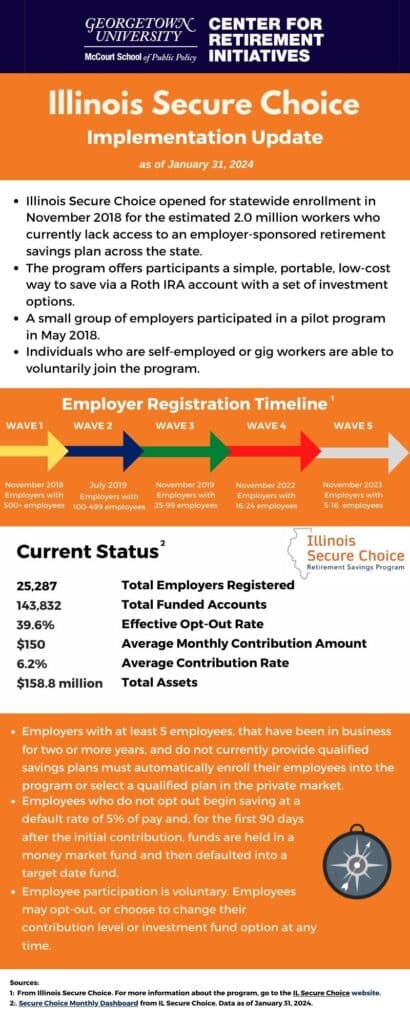
Illinois
(2018)
Key Program Metrics Snapshot
(as of December 31, 2023)
Program Performance Indicators, Monthly Percent Change
(as of December 31, 2023)
| 11/30/23 | 12/31/23 | Percent Change 11/30/23-12/31/23 | |
| Total Assets | $145,045,515 | $155,551,838 | 7.2% |
| Total Contribution Amount | $178,256,367 | $183,743,104 | 3.1% |
| Total Withdrawals | $45,212,817 | $47,038,829 | 4.0% |
| Total Funded Accounts | 136,450 | 140,956 | 3.3% |
| Accounts with Withdrawals (Full and Partial) | 37,167 | 38,115 | 2.6% |
| Average Contribution Rate | 5.8% | 5.8% | |
| Average Monthly Contribution Amount | $143 | $136 | -4.9% |
| Average Funded Account Balance | $1,063 | $1,104 | 3.8% |
| Effective Opt-Out Rate | 40.0% | 39.6% | |
| Total Registered Employers | 24,822 | 24,593 | -0.92% |
| Total Exempted Employers | 49,368 | 50,502 | 2.3% |
| Source: Calculations by the Georgetown University Center for Retirement Initiatives based on data from IL Secure Choice. | |||
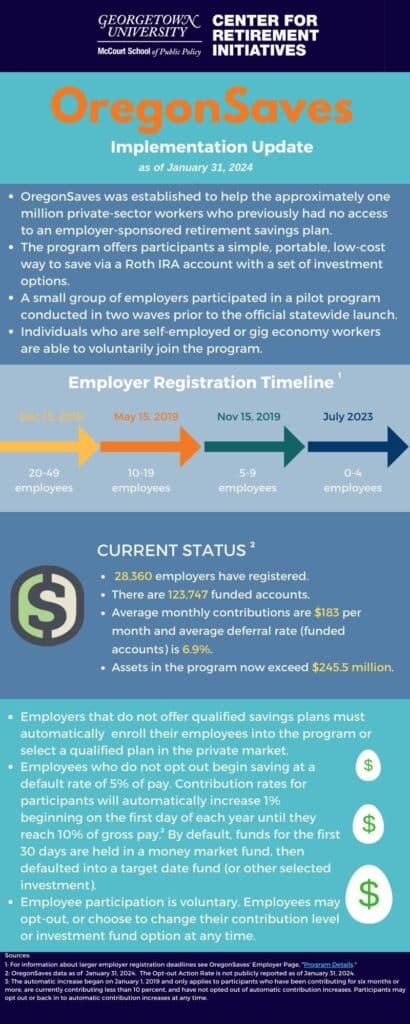
Oregon
(2017)
Key Program Metrics Snapshot
(as of December 31, 2023)
Program Performance Indicators, Monthly Percent Change
(as of December 31, 2023)
| 11/30/23 | 12/31/23 | Percent Change 11/30/23-12/31/23 | |
| Total Assets | $228,849,547 | $243,643,288 | 6.5% |
| Total Contributions Amount | $331,282,664 | $337,034,163 | 1.7% |
| Total Withdrawals | $108,239,930 | $111,265,135 | 2.8% |
| Total Funded Accounts | 123,420 | 124,570 | 0.93% |
| Accounts with a Withdrawal* | 47,348 | 48,227 | 1.9% |
| Average Contribution Rate | 6.30% | 6.30% | |
| Average Monthly Contribution Amount | $166 | $163 | -1.8% |
| Average Funded Account Balance | $1,854 | $1,956 | 5.5% |
| Opt-Out Action Rate* | 23.0% | 23.0% | |
| Total Registered Employers | 28,028 | 28,215 | 0.67% |
| Total Exempted Employers | 41,633 | 41,721 | 0.21% |
| Source: Calculations by the Georgetown University Center for Retirement Initiatives based on data from OregonSaves. *Opt-out Action Rate = savers opting-out within the last 30 days. Accounts With a Withdrawal = accounts with either full or partial withdrawals or both during the reporting period. | |||
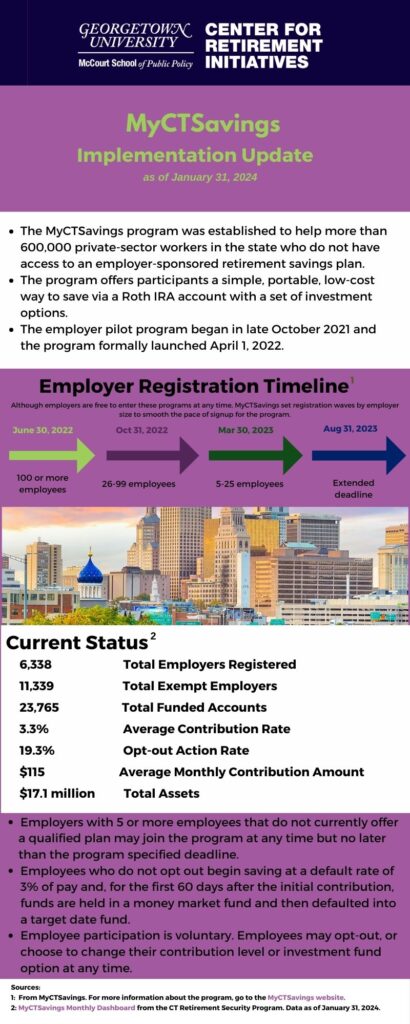
Connecticut
(2022)
Key Program Metrics Snapshot
(as of December 31, 2023)
Program Performance Indicators, Monthly Percent Change
(as of December 31, 2023)
| 11/30/23 | 12/31/23 | Percent Change 11/30/23-12/31/23 | |
| Total Assets | $13,446,434 | $15,730,669 | 17.0% |
| Total Contribution Amount | $14,124,750 | $15,720,892 | 11.3% |
| Total Withdrawals | $1,002,996 | $1,151,898 | 14.8% |
| Total Funded Accounts | 22,783 | 23,765 | 4.3% |
| Accounts with Withdrawals (Full and Partial) | 1,759 | 1,932 | 9.8% |
| Average Contribution Rate | 3.3% | 3.3% | |
| Average Monthly Contribution Amount | $107 | $114 | 5.8% |
| Average Funded Account Balance | $590 | $662 | 12.2% |
| Opt-Out Action Rate* | 19.7% | 19.7% | |
| Total Registered Employers | 6,273 | 6,325 | 0.83% |
| Total Exempted Employers | 11,287 | 11,320 | 0.29% |
| Source: Calculations by the Georgetown University Center for Retirement Initiatives based on data from MyCTSavings. *Opt-out Action Rate = savers opting-out within the last 30 days. | |||
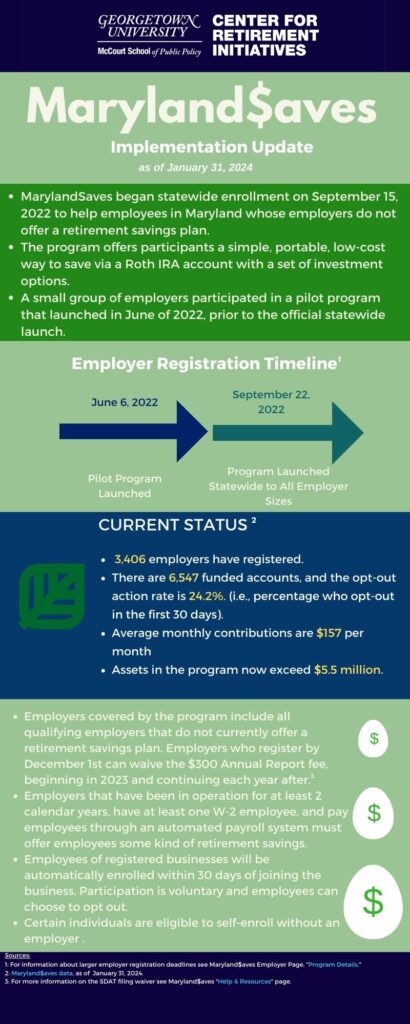
Maryland
(2022)
Key Program Metrics Snapshot
(as of December 31, 2023)
Program Performance Indicators, Monthly Percent Change
(as of December 31, 2023)
| 11/30/23 | 12/31/23 | Percent Change 11/30/23-12/31/23 | |
| Total Assets | $4,310,312 | $4,963,755 | 15.2% |
| Total Contributions Amount | $4,773,350 | $5,346,137 | 12.0% |
| Total Withdrawals | $523,473 | $616,394 | 17.8% |
| Total Funded Accounts | 5,388 | 5,900 | 9.5% |
| Accounts with Withdrawals (Full and Partial) | 807 | 918 | 13.8% |
| Average Contribution Rate | 5.0% | 5.0% | |
| Average Monthly Contribution Amount | $151 | $159 | 5.0% |
| Average Funded Account Balance | $800 | $841 | 5.2% |
| Opt-Out Action Rate* | 21.8% | 23.8% | |
| Total Registered Employers | 2,764 | 2,814 | 1.8% |
| Total Exempted Employers | 3,921 | 4,440 | 13.2% |
| Source: Calculations by the Georgetown University Center for Retirement Initiatives based on data from Maryland$aves. *Opt-out Action rate = savers opting-out within the last 30 days. | |||
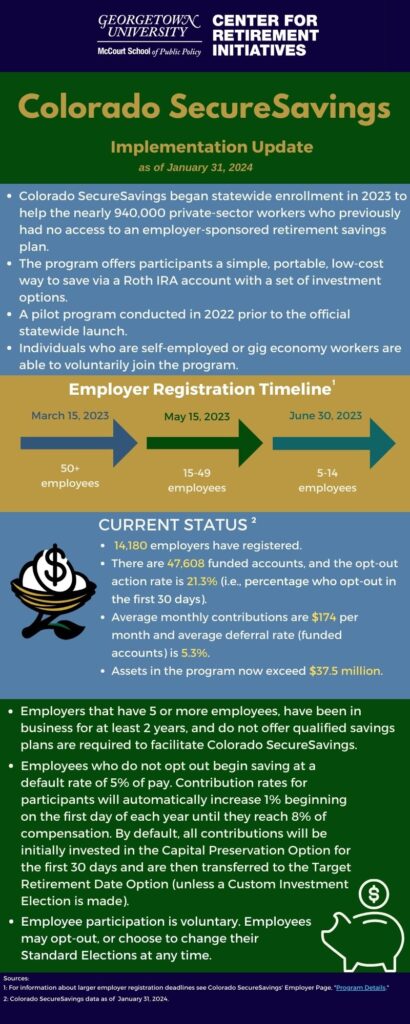
Colorado
(2023)
Key Program Metrics Snapshot
(as of December 31, 2023)
Program Performance Indicators, Monthly Percent Change
(as of December 31, 2023)
| 11/30/23 | 12/31/23 | Percent Change 11/30/23-12/31/23 | |
| Total Assets | $27,540,238 | $33,576,625 | 21.9% |
| Total Contribution Amount | $29,013,450 | $33,422,121 | 15.2% |
| Total Withdrawals | $1,925,155 | $2,489,813 | 29.3% |
| Total Funded Accounts | 43,402 | 45,863 | 5.7% |
| Accounts with Withdrawals (Full and Partial) | 3,677 | 4,247 | 15.5% |
| Average Contribution Rate | 5.0% | 5.0% | |
| Average Monthly Contribution Amount | $161 | $161 | -0.11% |
| Average Funded Account Balance | $635 | $732 | 15.4% |
| Opt-Out Action Rate* | 21.5% | 21.3% | |
| Total Registered Employers | 13,284 | 13,992 | 5.3% |
|
Total Exempted Employers |
25,004 |
26,036 |
4.1% |
| Source: Calculations by the Georgetown University Center for Retirement Initiatives based on data from Colorado SecureSavings. Opt-out Action rate = savers who opt-out only within the last 30 days. | |||
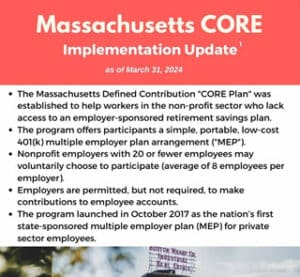
Massachusetts
Key Program Metrics Snapshot
(as of December 31, 2023)
Washington
Key Program Metrics Snapshot
(as of June 2020)

Monthly Cumulative State Program Total Assets
ALL STATES (CA, IL, OR, CT, MA, MD, and WA)
Monthly Cumulative State Auto-IRA* Program Performance Metrics (CA, CT, CO, IL, MD and OR)
*excludes MA and WA
Program Performance Indicators
Monthly Percent Change
(as of December 31, 2023)
| 11/30/23 | 12/31/23 | Percent Change 11/30/23- 12/31/23 | |
| Total Assets | $1,107,793,098 | $1,203,442,425 | 8.6% |
| Total Funded Accounts | 802,746 | 820,424 | 2.2% |
| Total Registered Employers | 199,742 | 207,189 | 3.7% |
| Total Exempted Employers | 252,501 | 258,840 | 2.5% |
| Source: Calculations by the Georgetown University Center for Retirement Initiatives based on data from CalSavers, IL Secure Choice, MyCTSavings, OregonSaves, Maryland$aves, and Colorado SecureSavings. | |||
Quarterly State Program Performance Data & Trends
California
| 12/31/21 | 6/30/22 | Percent Change 12/31/21-6/30/22 | 9/30/22 | 12/31/22 | Percent Change 9/30/22-12/31/22 | Percent Change
12/31/21-12/31/22 |
|
| Total Assets | $173,022,007
|
$223,049,153 | 28.9% | $272,215,635 | $372,979,988 | 37.0%
|
115.6%
|
| Total Funded Accounts | 217,892
|
276,862 | 27.1% | 360,237 | 395,972 | 9.9%
|
81.7%
|
| Total Withdrawals | $20,493,838
|
$40,893,704 | 99.5% | $53,300,368
|
$68,275,908 | 28.1% | 233.2%
|
| Accounts with Withdrawals | 32,923
|
48,693 | 47.9% | $58,869 | $69,577 | 18.2%
|
111.3%
|
| Average Deferral Rate | 5.02%
|
5.08% | 5.07% | 5.07% | |||
| Average Monthly Contribution Amount | $150
|
$168 | 12.0% | $166 | $169 | 1.8%
|
12.7%
|
| Average Funded Account Balance | $794
|
$806 | 1.5% | $756 | $942 | 24.6%
|
18.6%
|
| Effective Opt Out Rates | 29.74% | 36.64% | 37.41% | 36.84% | |||
| Total Registered Employers | 23,203
|
98,417 | 324.2% | 109,245 | 115,705 | 5.9%
|
398.7%
|
| Total Added Employee Data | 15,008 | 63,474 | 322.9% | 88,498 | 94,552 | 6.8%
|
530.0%
|
| Employers Submitting Payroll
Deductions (last 90 days) |
N/A | 13,755¹ | 53.5% | 31,051
|
33,802 | 8.9%
|
N/A
|
| ¹I¹California began reporting Actively Submitting Payroll (Past 90 Days) on February 28, 2022.
Source: Calculations by the Georgetown University Center for Retirement Initiatives based on data from CalSavers. |
|||||||
Illinois
| 12/31/21
|
6/30/22 | Percent Change 12/31/21-6/30/22
|
9/30/22
|
12/31/22
|
Percent Change 9/30/22-12/31/22
|
Percent Change
12/31/21-12/31/22
|
|
| Total Assets | $84,871,970 | $82,742,994 | -2.5%
|
$83,977,073 | $98,466,419 | 17.3%
|
16.0%
|
| Total Funded Accounts | 99,082 | 105,459 | 6.4%
|
109,346 | 116,216 | 6.3%
|
17.3%
|
| Total Withdrawals | $15,539,645 | $22,369,318 | 43.9%
|
$25,695,321 | $28,766,940 | 12.0%
|
85.1%
|
| Accounts with Withdrawals | 20,796 | 24,625 | 18.4%
|
26,094 | 27,506 | 5.41% | 32.27% |
| Average Deferral Rate | 5.05% | 5.56% | 5.53% | 5.49% | |||
| Average Monthly Contribution Amount | $118.19 | $135.14 | 14.3%
|
$144 | $131 | -9.5%
|
10.5%
|
| Average Funded Account Balance | $856.58 | $784.60 | -8.4% | $768 | $847 | 10.3%
|
-1.1%
|
| Effective Opt Out Rates | 33.30% | 32.80% | 31.92% | 32.17% | |||
| Total Registered Employers | 6,408 | 6,498 | 1.4%
|
7,486 | 9,312 | 24.4%
|
45.32% |
| Total Added Employee Data | 4,315 | 4,450 | 3.1%
|
5,148 | 7,211 | 40.1% | 67.1% |
| Employers Submitting Payroll Deductions (last 90 days) | N/A | 2,333¹ | N/A
|
2,404 | 3,044 | 26.6% | N/A |
| ¹Illinois began reporting Actively Submitting Payroll (Past 90 Days) on April 30, 2022.
Source: Calculations by the Georgetown University Center for Retirement Initiatives based on data from IL Secure Choice. |
|||||||
Oregon
| 12/31/21 | 6/30/22 | Percent Change 12/31/21-6/30/22 | 9/30/22 | 12/31/22
|
Percent Change 9/30/22-12/31/22
|
Percent Change
12/31/21-12/31/22
|
|
| Total Assets | $150,010,539 | $146,004,291 | -2.7% | $148,185,293 | $168,705,846 | 13.9% | 12.5%
|
| Total Funded Accounts | 112,689 | 115,046 | 2.1% | 115,569 | 115,863 | 0.3% | 2.8%
|
| Total Withdrawals | $39,274,450 | $54,286,395 | 38.2% | $62,368,689 | $70,672,308 | 13.3% | 79.9%
|
| Accounts with Withdrawals | 20,314 | 27,577 | 35.8% | 31,153 | 34,521 | 10.8% | 69.9%
|
| Average Deferral Rate | 5.60% | 6.20% | 6.10% | 6.00% | |||
| Average Monthly Contribution Amount | $166 | $176 | 6.0% | $159 | $157 | -1.3% | -5.4% |
| Average Funded Account Balance | $1,331 | $1,269 | -4.7% | $1,282 | $1,456 | 13.6% | 9.4%
|
| Effective Opt Out Rates | *N/A | 25.6%1 | 24.8%1 | 24.1%1 | |||
| Total Registered Employers | 17,025 | 17,037 | 0.07% | 17,187 | 17,671 | 2.8% | 3.8%
|
| Total Added Employee Data | 14,931 | 15,146 | 1.4% | 15,516 | 16,059 | 3.5% | 7.6%
|
| Employers Submitting Payroll Deductions (last 90 days) | N/A | 5,2802 | N/A | 5,2622 | 5,234 | -0.53% | N/A |
| 1In March 2022, OregonSaves began reporting an Opt-Out Action Rate defined as percentage of savers who opt out in the first 30 days.
2Oregon replaced Total submitting Payroll Contributions with Actively Submitting Payroll (Past 90 Days) on March 30, 2022. |
|||||||
Quarterly Cumulative State Program Performance Metrics (CA, IL, and OR)
| 12/31/21 | 6/30/2022
|
Percent Change 12/31/22-6/30/22 | 9/30/22
|
12/31/22
|
Percent Change 9/30/22-12/31/22
|
Percent Change
12/31/21-12/31/22
|
|
| Total Assets | $407,904,516 | $451,796,438 | 12.40% | $504,378,001 | $640,152,253 | 26.9% | 56.9%
|
| Total Funded Accounts | 429,663 | 497,367 | 0.01% | 585,152 | 628,051 | 7.3% | 46.2% |
| Total Registered Employers | 46,636 | 121,952 | 0.02% | 133,918 | 142,688 | 6.5% | 206.0% |
| Total Added Employee Data | 34,254 | 83,070 | 0.28% | 109,162 | 117,822 | 7.9% | 244.0% |
| Employers Submitting Payroll Deductions (last 90 days) | N/A | 22,114¹ | N/A | 39,581¹ | 42,994¹ | 8.6% | N/A |
| 1Oregon replaced Total submitting Payroll Contributions with Actively Submitting Payroll (Past 90 Days) on March 30, 2022.
Source: Calculations by the Georgetown University Center for Retirement Initiatives based on data from CalSavers, IL Secure Choice, and OregonSaves. |
|||||||
Semi-Annual and Annual State Program Performance Data & Trends
Semi-Annual and Annual State Program Performance Metrics (CA, IL, and OR)
| 12/31/21 | 6/30/2022 | Percent Change 12/31/22-6/30/22 | 12/31/22 | Percent Change 6/30/22-12/31/22 | Percent Change
12/31/21-12/31/22 |
|
| Total Assets | $407,904,516 | $451,796,438 | 10.76% | $640,152,253 | 41.69% | 56.9% |
| Total Funded Accounts | 429,663 | 497,367 | 15.76% | 628,051 | 26.28% | 46.2% |
| Total Registered Employers | 46,636 | 121,952 | 161.50% | 142,688 | 17.00% | 206.0% |
| Total Added Employee Data | 34,254 | 83,070 | 142.51% | 117,822 | 41.83% | 244.0% |
| Employers Submitting Payroll (Past 90 Days) | N/A | 22,114¹ | N/A | 42,994¹ | 94.42% | N/A |
| ¹In March 2022 (as part of April 30, 2022 dashboard report), OregonSaves began reporting Actively Submitting Payroll (Past 90 Days) instead of Total Submitting Payroll. Source: Calculations by the Georgetown University Center for Retirement Initiatives based on data from CalSavers, IL Secure Choice, and OregonSaves. |
||||||